Sample Splunk Query (Get Messages)
index="lamaxu_stats" sourcetype="qmresetqstats_json" "identifier.dataType"=RESETQSTATS "attributes.QUEUE"!="AMQ.*"|rename identifier.dataSource as qmgrName|rename attributes.QUEUE as queueName|rename attributes.getMsgs as getMsgs|eval label="(".qmgrName.") ".queueName|timechart useother=f span=1m max(getMsgs) by label limit=1000
Sample Splunk Query (Put Messages)
index="lamaxu_stats" sourcetype="qmresetqstats_json" "identifier.dataType"=RESETQSTATS "attributes.QUEUE"!="AMQ.*"|rename identifier.dataSource as qmgrName|rename attributes.QUEUE as queueName|rename attributes.putMsgs as putMsgs|eval label="(".qmgrName.") ".queueName|timechart useother=f span=1m max(putMsgs) by label limit=1000
Sample Splunk Query (Max Queue Depth)
index="lamaxu_stats" sourcetype="qmresetqstats_json" "identifier.dataType"=RESETQSTATS "attributes.QUEUE"!="AMQ.*"|rename identifier.dataSource as qmgrName|rename attributes.QUEUE as queueName|rename attributes.maxQueueDepth as maxQueueDepth|eval label="(".qmgrName.") ".queueName|timechart useother=f span=1m max(maxQueueDepth) by label limit=1000
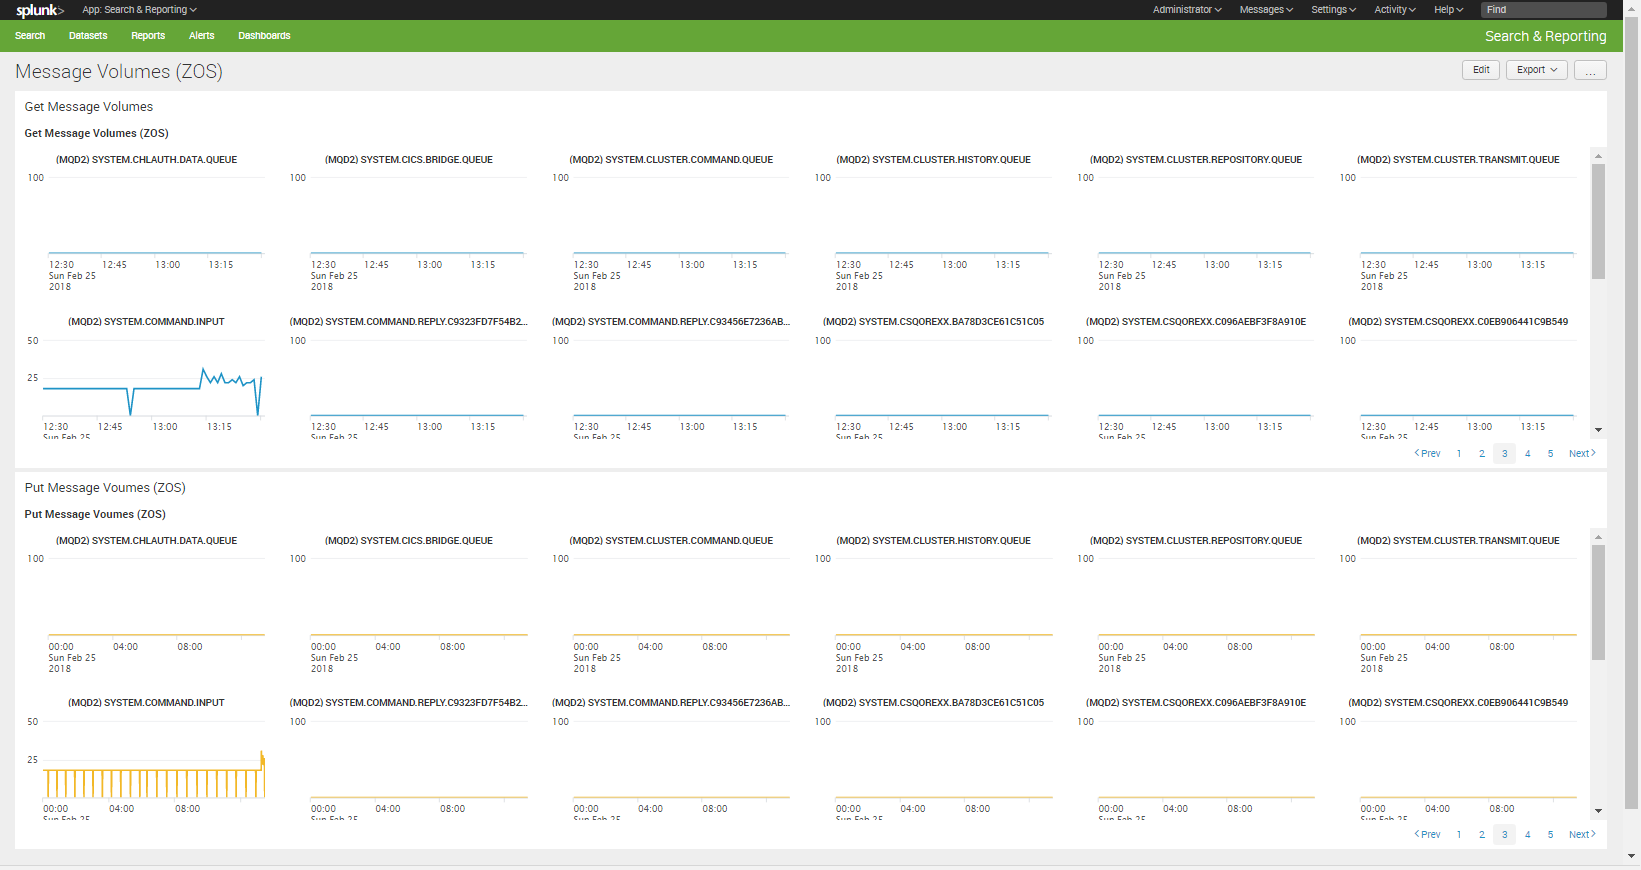
Sample Dashboard Using Trellis


Sample Dashboard Source
<dashboard>
  <label>Message Volumes (ZOS)</label>
    <row>
    <panel>
      <title>Max Queue Depth (ZOS)</title>
      <chart>
        <title>Max Queue Depth (ZOS)</title>
        <search>
          <query>index="lamaxu_stats" sourcetype="qmresetqstats_json" "identifier.dataType"=RESETQSTATS "attributes.QUEUE"!="AMQ.*"|rename identifier.dataSource as qmgrName|rename attributes.QUEUE as queueName|rename attributes.maxQueueDepth as maxQueueDepth|eval label="(".qmgrName.") ".queueName|timechart useother=f span=1m  max(maxQueueDepth) by label limit=1000</query>
          <earliest>@d</earliest>
          <latest>now</latest>
          <sampleRatio>1</sampleRatio>
        </search>
        <option name="charting.axisLabelsX.majorLabelStyle.overflowMode">ellipsisNone</option>
        <option name="charting.data.count">100000</option>
        <option name="charting.axisLabelsX.majorLabelStyle.rotation">0</option>
        <option name="charting.axisTitleX.visibility">collapsed</option>
        <option name="charting.axisTitleY.visibility">collapsed</option>
        <option name="charting.axisTitleY2.visibility">collapsed</option>
        <option name="charting.axisX.abbreviation">none</option>
        <option name="charting.axisX.scale">linear</option>
        <option name="charting.axisY.abbreviation">none</option>
        <option name="charting.axisY.scale">linear</option>
        <option name="charting.axisY2.abbreviation">none</option>
        <option name="charting.axisY2.enabled">0</option>
        <option name="charting.axisY2.scale">inherit</option>
        <option name="charting.chart">line</option>
        <option name="charting.chart.bubbleMaximumSize">50</option>
        <option name="charting.chart.bubbleMinimumSize">10</option>
        <option name="charting.chart.bubbleSizeBy">area</option>
        <option name="charting.chart.nullValueMode">zero</option>
        <option name="charting.chart.showDataLabels">none</option>
        <option name="charting.chart.sliceCollapsingThreshold">0.01</option>
        <option name="charting.chart.stackMode">default</option>
        <option name="charting.chart.style">shiny</option>
        <option name="charting.drilldown">none</option>
        <option name="charting.layout.splitSeries">0</option>
        <option name="charting.layout.splitSeries.allowIndependentYRanges">0</option>
        <option name="charting.legend.labelStyle.overflowMode">ellipsisMiddle</option>
        <option name="charting.legend.mode">standard</option>
        <option name="charting.legend.placement">none</option>
        <option name="charting.lineWidth">2</option>
        <option name="refresh.display">progressbar</option>
        <option name="trellis.enabled">1</option>
        <option name="trellis.scales.shared">0</option>
        <option name="trellis.size">small</option>
      </chart>
    </panel>
  </row>
  <row>
    <panel>
      <title>Get Message Volumes</title>
      <chart>
        <title>Get Message Volumes (ZOS)</title>
        <search>
          <query>index="lamaxu_stats"  sourcetype="qmresetqstats_json" "identifier.dataType"=RESETQSTATS "attributes.QUEUE"!="AMQ.*"|rename identifier.dataSource as qmgrName|rename attributes.QUEUE as queueName|rename attributes.getMsgs as getMsgs|eval label="(".qmgrName.") ".queueName|timechart useother=f span=1m max(getMsgs) by label limit=1000</query>
          <earliest>@d</earliest>
          <latest>now</latest>
          <sampleRatio>1</sampleRatio>
        </search>
        <option name="charting.axisLabelsX.majorLabelStyle.overflowMode">ellipsisNone</option>
        <option name="charting.data.count">100000</option>
        <option name="charting.axisLabelsX.majorLabelStyle.rotation">0</option>
        <option name="charting.axisTitleX.visibility">collapsed</option>
        <option name="charting.axisTitleY.visibility">collapsed</option>
        <option name="charting.axisTitleY2.visibility">collapsed</option>
        <option name="charting.axisX.abbreviation">none</option>
        <option name="charting.axisX.scale">linear</option>
        <option name="charting.axisY.abbreviation">none</option>
        <option name="charting.axisY.scale">linear</option>
        <option name="charting.axisY2.abbreviation">none</option>
        <option name="charting.axisY2.enabled">0</option>
        <option name="charting.axisY2.scale">inherit</option>
        <option name="charting.chart">line</option>
        <option name="charting.chart.bubbleMaximumSize">50</option>
        <option name="charting.chart.bubbleMinimumSize">10</option>
        <option name="charting.chart.bubbleSizeBy">area</option>
        <option name="charting.chart.nullValueMode">zero</option>
        <option name="charting.chart.showDataLabels">none</option>
        <option name="charting.chart.sliceCollapsingThreshold">0.01</option>
        <option name="charting.chart.stackMode">default</option>
        <option name="charting.chart.style">shiny</option>
        <option name="charting.drilldown">none</option>
        <option name="charting.layout.splitSeries">0</option>
        <option name="charting.layout.splitSeries.allowIndependentYRanges">0</option>
        <option name="charting.legend.labelStyle.overflowMode">ellipsisMiddle</option>
        <option name="charting.legend.mode">standard</option>
        <option name="charting.legend.placement">none</option>
        <option name="charting.lineWidth">2</option>
        <option name="refresh.display">progressbar</option>
        <option name="trellis.enabled">1</option>
        <option name="trellis.scales.shared">0</option>
        <option name="trellis.size">small</option>
      </chart>
    </panel>
  </row>
  <row>
    <panel>
      <title>Put Message Voumes (ZOS)</title>
      <chart>
        <title>Put Message Voumes (ZOS)</title>
        <search>
          <query>index="lamaxu_stats" sourcetype="qmresetqstats_json" "identifier.dataType"=RESETQSTATS "attributes.QUEUE"!="AMQ.*"|rename identifier.dataSource as qmgrName|rename attributes.QUEUE as queueName|rename attributes.putMsgs as putMsgs|eval label="(".qmgrName.") ".queueName|timechart useother=f span=1m  max(putMsgs) by label limit=1000</query>
          <earliest>@d</earliest>
          <latest>now</latest>
          <sampleRatio>1</sampleRatio>
        </search>
        <option name="charting.axisLabelsX.majorLabelStyle.overflowMode">ellipsisNone</option>
        <option name="charting.data.count">100000</option>
        <option name="charting.axisLabelsX.majorLabelStyle.rotation">0</option>
        <option name="charting.axisTitleX.visibility">collapsed</option>
        <option name="charting.axisTitleY.visibility">collapsed</option>
        <option name="charting.axisTitleY2.visibility">collapsed</option>
        <option name="charting.axisX.abbreviation">none</option>
        <option name="charting.axisX.scale">linear</option>
        <option name="charting.axisY.abbreviation">none</option>
        <option name="charting.axisY.scale">linear</option>
        <option name="charting.axisY2.abbreviation">none</option>
        <option name="charting.axisY2.enabled">0</option>
        <option name="charting.axisY2.scale">inherit</option>
        <option name="charting.chart">line</option>
        <option name="charting.chart.bubbleMaximumSize">50</option>
        <option name="charting.chart.bubbleMinimumSize">10</option>
        <option name="charting.chart.bubbleSizeBy">area</option>
        <option name="charting.chart.nullValueMode">zero</option>
        <option name="charting.chart.showDataLabels">none</option>
        <option name="charting.chart.sliceCollapsingThreshold">0.01</option>
        <option name="charting.chart.stackMode">default</option>
        <option name="charting.chart.style">shiny</option>
        <option name="charting.drilldown">none</option>
        <option name="charting.layout.splitSeries">0</option>
        <option name="charting.layout.splitSeries.allowIndependentYRanges">0</option>
        <option name="charting.legend.labelStyle.overflowMode">ellipsisMiddle</option>
        <option name="charting.legend.mode">standard</option>
        <option name="charting.legend.placement">none</option>
        <option name="charting.lineWidth">2</option>
        <option name="refresh.display">progressbar</option>
        <option name="trellis.enabled">1</option>
        <option name="trellis.scales.shared">0</option>
        <option name="trellis.size">small</option>
      </chart>
    </panel>
  </row>
</dashboard>

