Queue Manager Status Dashboard
Sample Splunk Query
index="lamaxu" sourcetype="qmstatus_json" "identifier.dataType"=QMGR_STATUS "identifier.dataSource"=TEST|rename attributes.STATUS as qmstatus|eval status = if(like(qmstatus,"RUNNING"), 0, 1)|table status | rangemap field=status low=0-0 default=severe | eval status=case(status== 0, "TEST", status== 1, "TEST")
Trellis Dashboard Query (Splunk 6.7 and above)
Using Trellis creates a dynamic view of the Queue Manager statuses. It does not require the dashboard to be edited when new channels are added.
index="lamaxu" sourcetype="qmstatus_json" "identifier.dataType"=QMGR_STATUS |rename identifier.dataSource as qmgrName| rename attributes.STATUS as qmStatus|eval label="(".qmgrName.") - ".qmStatus|eval status = case(like(qmStatus,"RUNNING"), 0, like(chlstatus,"STOPPED"),1)|chart max(status) by label
Sample Dashboard
Dashboard Source
Queue Manager Status Trellis Dashboard
Channel Status Dashboard
Sample Splunk Query
index="lamaxu" sourcetype="qmstatus_json" "identifier.dataType"=CHANNEL_STATUS "identifier.dataSource"=DEMO "attributes.CHANNEL"=TEST|rename attributes.STATUS as chlstatus|eval status = case(like(chlstatus,"RUNNING"), 0,like(chlstatus,"INACTIVE"), 1, like(chlstatus,"STOPPED"), 1, like(chlstatus,"RETRY"), 2)|table status | rangemap field=status low=0-0 elevated=1-1 severe=2-2 default=severe | eval status=case(status== 0, "TEST.CHANNEL", status== 1, "TEST.CHANNEL", status== 2, "TEST.CHANNEL")
Trellis Dashboard Query (Splunk 6.7 and above)
index="lamaxu" sourcetype="qmstatus_json" "identifier.dataType"=CHANNEL_STATUS |rename attributes.CHANNEL as chlName|rename identifier.dataSource as qmgrName| rename attributes.STATUS as chlstatus|eval label="(".qmgrName.") ".chlName." - ".chlstatus|eval status = case(like(chlstatus,"RUNNING"), 0,like(chlstatus,"INACTIVE"), 1, like(chlstatus,"STOPPED"), 1, like(chlstatus,"RETRY"), 2)|chart max(status) by label
Sample Dashboard
Dashboard Source
Channel Status Dashboard Source Using Trellis
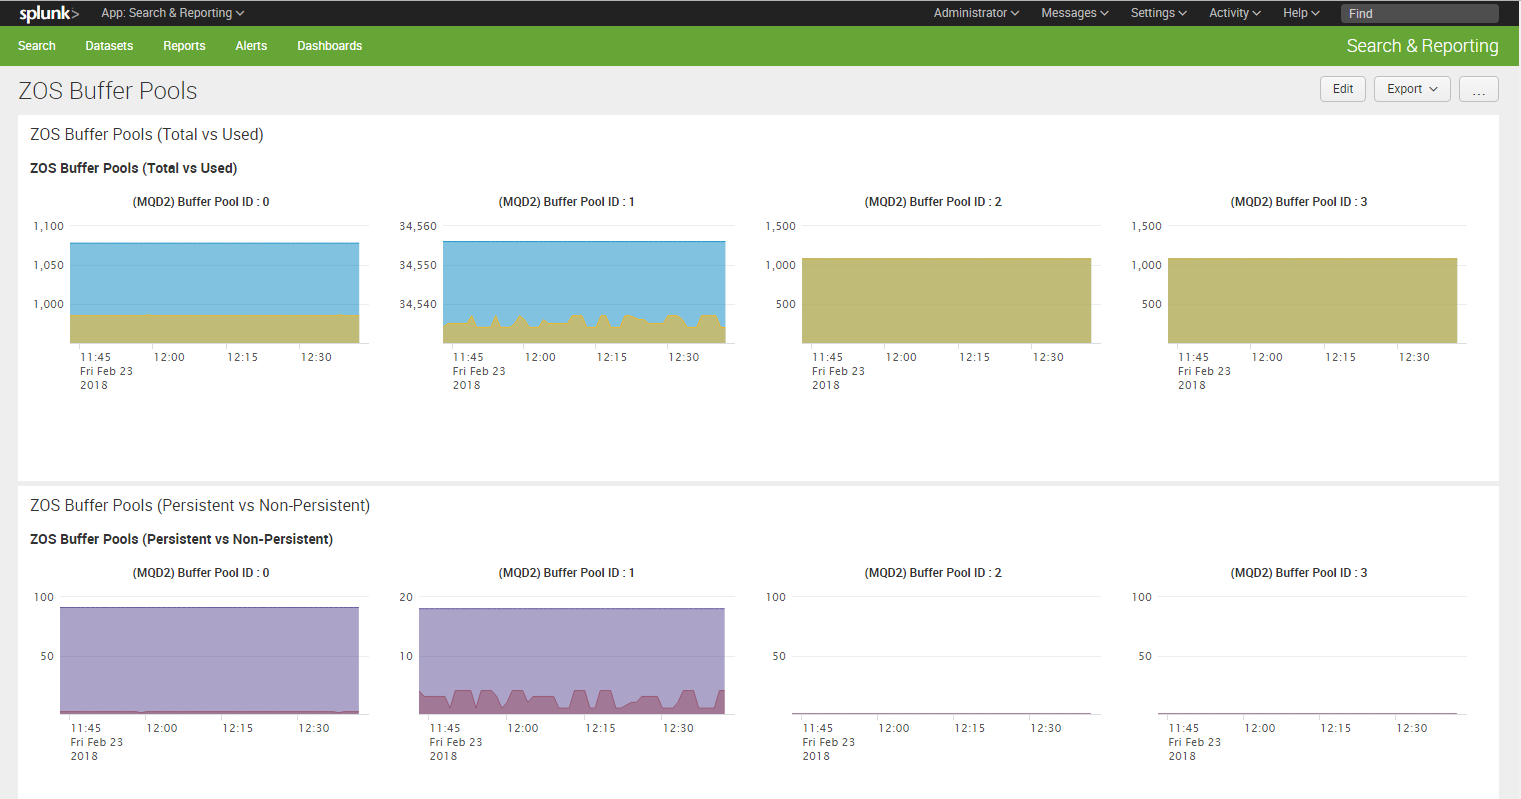
ZOS Buffer Pools Dashboard
Splunk Query for ZOS Buffer Pools (Total vs Used)
index="lamaxu" sourcetype="qmstatus_json" "identifier.dataType"=PAGESET_USAGE |rename identifier.dataSource as qmgrName|rename attributes.BUFFER_POOL_ID as bufferPoolId| eval objName="(".qmgrName.") Buffer Pool ID : ".bufferPoolId|timechart span=1m max(attributes.TOTAL_PAGES) as "Total Pages" max(attributes.UNUSED_PAGES) as "Unused Pages" BY objName
Splunk Query for ZOS Buffer Pools (Persistent vs Non-Persistent)
index="lamaxu" sourcetype="qmstatus_json" "identifier.dataType"=PAGESET_USAGE |rename identifier.dataSource as qmgrName|rename attributes.BUFFER_POOL_ID as bufferPoolId| eval objName="(".qmgrName.") Buffer Pool ID : ".bufferPoolId|timechart span=1m max(attributes.PERSIST_PAGES) as "Perisitent Pages" max(attributes.NONPERSIST_PAGES) as "Non Persistent Pages" BY objName
Sample Dashboard
Dashboard Source
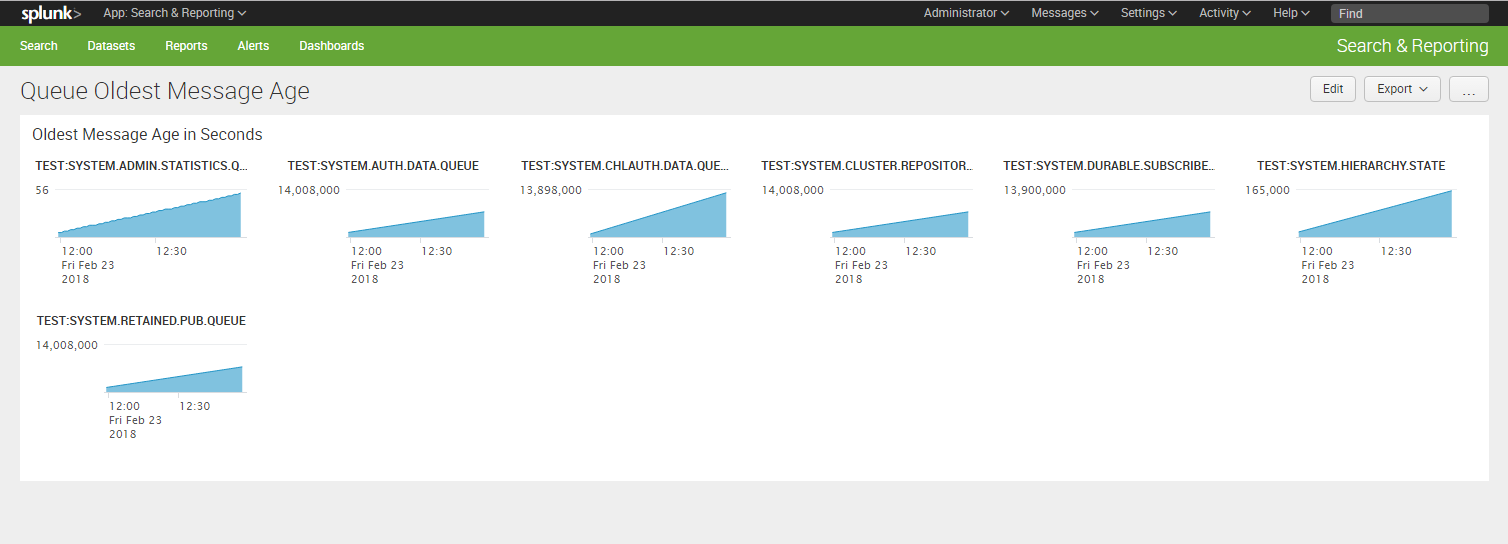
Queue Oldest Message Age Dashboard
Sample Splunk Query
index="lamaxu" sourcetype="qmstatus_json" "identifier.dataType"=QUEUE_STATUS attributes.MSGAGE!=-1 attributes.MSGAGE > 20|rename identifier.dataSource as qmgrName|rename attributes.QUEUE as queueName|rename attributes.MSGAGE as MsgAge| eval objName=qmgrName.":".queueName|timechart span=1m max(MsgAge) BY objName
Sample Dashboard
Sample Dashboard Source
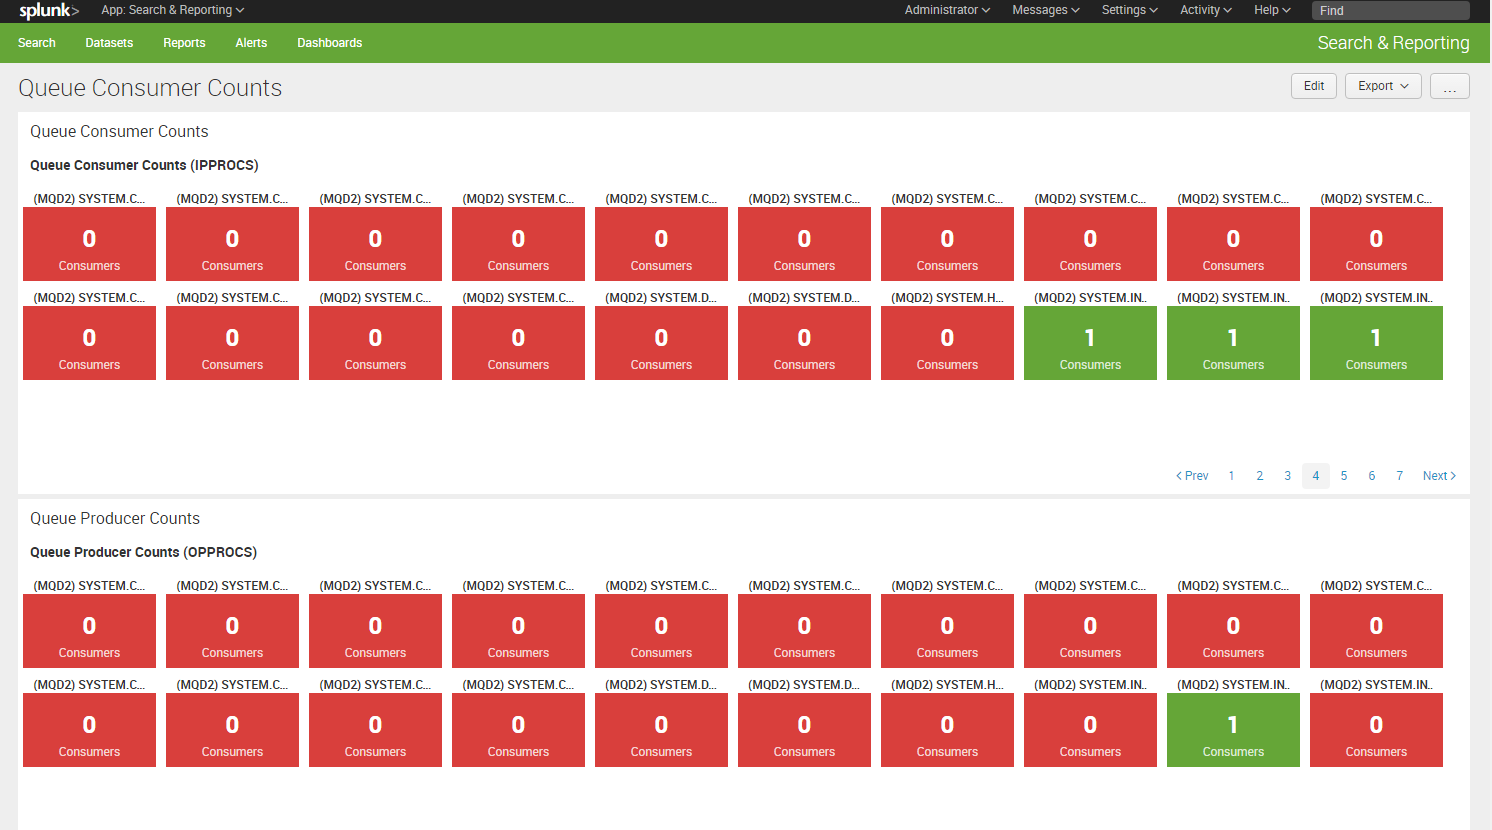
Queue Consumer / Producer Dashboard
Sample Splunk Queries
index="lamaxu" sourcetype="qmstatus_json" "identifier.dataType"=QUEUE_STATUS attributes.IPPROCS!=-1 |rename identifier.dataSource as qmgrName|rename attributes.QUEUE as queueName|rename attributes.IPPROCS as Consumers| eval objName="(".qmgrName.") ".queueName|chart max(Consumers) as Consumers BY objName
index="lamaxu" sourcetype="qmstatus_json" "identifier.dataType"=QUEUE_STATUS attributes.OPPROCS!=-1 |rename identifier.dataSource as qmgrName|rename attributes.QUEUE as queueName|rename attributes.OPPROCS as Producers| eval objName="(".qmgrName.") ".queueName|chart max(Producers) as Producers BY objName
Sample Dashboard
Sample Dashboard Source
Queue Current Queue Depth Dashboard (CURDEPTH)
Sample Splunk Query
index="lamaxu" sourcetype="qmstatus_json" "identifier.dataType"=QUEUE_STATUS attributes.CURDEPTH!=-1|rename identifier.dataSource as qmgrName|rename attributes.QUEUE as queueName|rename attributes.CURDEPTH as curDepth| eval label=qmgrName.":".queueName|chart useother=f max(curDepth) BY label limit=1000
Sample Dashboard
Sample Dashboard Source
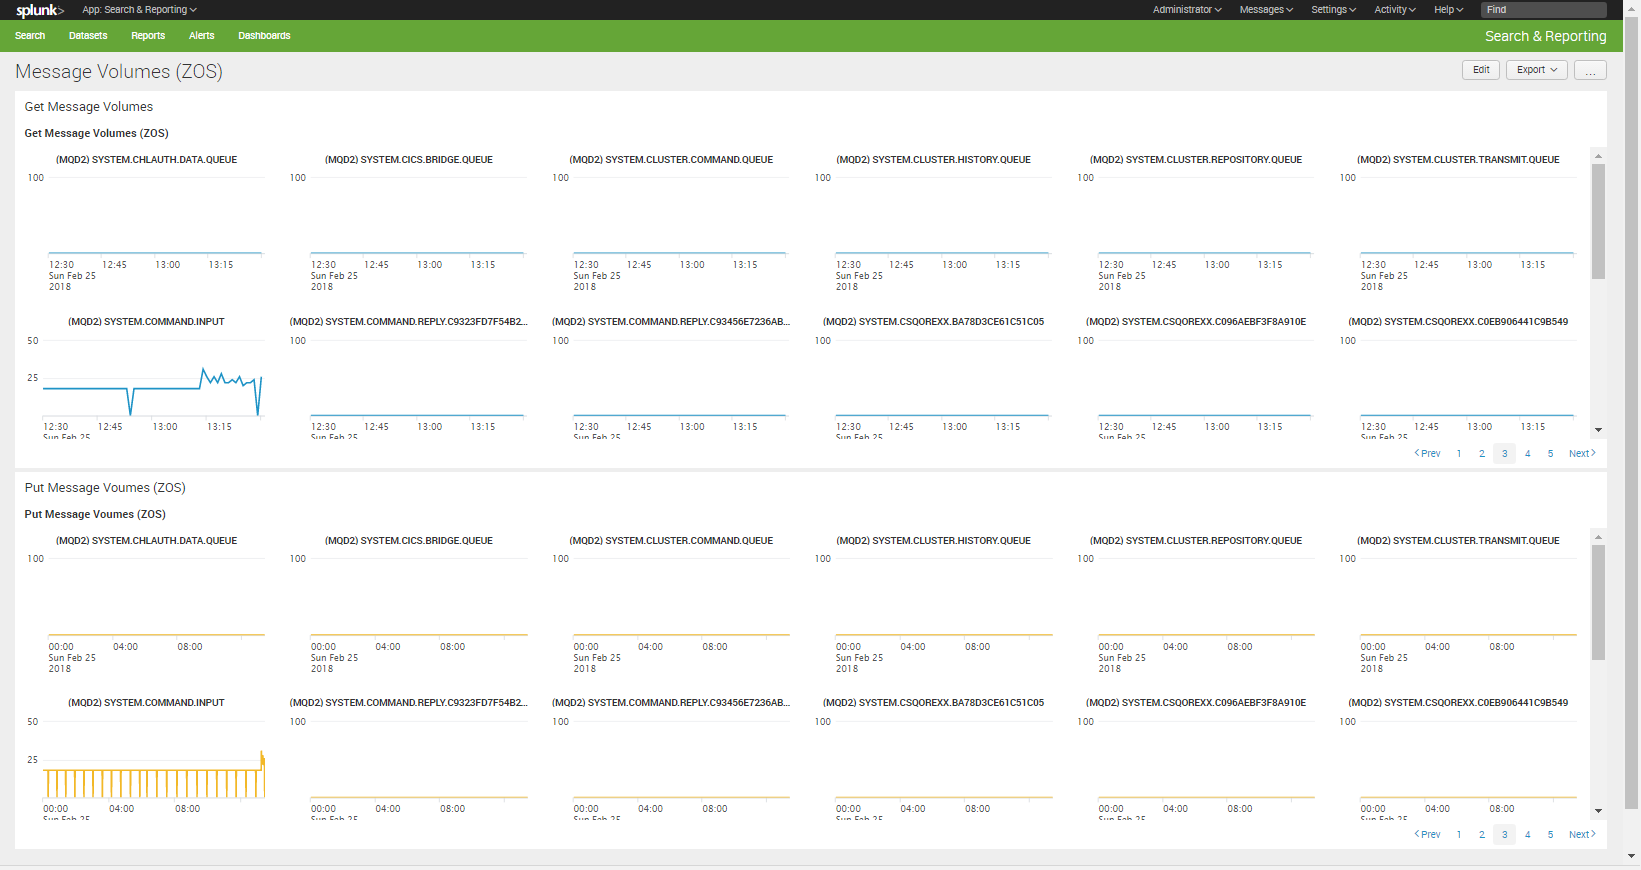
Queue Message Volumes Trellis Dashboards (ZOS)
Sample Splunk Query (Get Messages)
index="lamaxu_stats" sourcetype="qmresetqstats_json" "identifier.dataType"=RESETQSTATS "attributes.QUEUE"!="AMQ.*"|rename identifier.dataSource as qmgrName|rename attributes.QUEUE as queueName|rename attributes.getMsgs as getMsgs|eval label="(".qmgrName.") ".queueName|timechart useother=f span=1m max(getMsgs) by label limit=1000
Sample Splunk Query (Put Messages)
index="lamaxu_stats" sourcetype="qmresetqstats_json" "identifier.dataType"=RESETQSTATS "attributes.QUEUE"!="AMQ.*"|rename identifier.dataSource as qmgrName|rename attributes.QUEUE as queueName|rename attributes.putMsgs as putMsgs|eval label="(".qmgrName.") ".queueName|timechart useother=f span=1m max(putMsgs) by label limit=1000
Sample Splunk Query (Max Queue Depth)
index="lamaxu_stats" sourcetype="qmresetqstats_json" "identifier.dataType"=RESETQSTATS "attributes.QUEUE"!="AMQ.*"|rename identifier.dataSource as qmgrName|rename attributes.QUEUE as queueName|rename attributes.maxQueueDepth as maxQueueDepth|eval label="(".qmgrName.") ".queueName|timechart useother=f span=1m max(maxQueueDepth) by label limit=1000
Sample Dashboard Using Trellis
Sample Dashboard Source
Channel Connections (CONNS) Dashboard
Sample Splunk Query
index="lamaxu" sourcetype="qmstatus_json" "identifier.dataType"=CHANNEL_STATUS "attributes.CHANNEL"!=SYSTEM.*|rename identifier.dataSource as qmgrName|rename attributes.CHANNEL as channelName|rename attributes.CONNS as connections |eval objName="(CONNS=".connections.") (".qmgrName.") ".channelName|chart useother=f max(connections) BY objName limit=1000
Sample Dashboard
Sample Dashboard Source
Qmgr Connections (CONNS) and Listeners Dashboard
Sample Splunk Queries
Qmgr Connections
index="lamaxu" sourcetype="qmstatus_json" "identifier.dataType"=QMGR_STATUS| rename attributes.PLATFORM_mqsc as platform|rename attributes.CONNS as conns|rename identifier.dataSource as qmgrName|eval label=qmgrName." - (".platform.")"|chart max(conns) as "Connections" by label
ListenerStatus
index="lamaxu" sourcetype="qmstatus_json"|rename identifier.dataSource as qmgrName| rename attributes.STATUS_mqsc as status|rename attributes.LISTENER as listener|eval lstatus = case(like(status,"RUNNING"), 1, like(status,"INACTIVE"), 1, like(status,"STOPPED"), 0, like(status,"RETRY"), 0)| eval label="(".lstatus.") ".status.", [".qmgrName."] : ".listener|chart max(lstatus) by label


