Defining the AppDynamics Agent
Please contact your AppDynamics administrators as they need to generate, and provide you with, a new client configuration bundle for every Lamaxu agent deployed.
The ./conf/controller-info.xml located in the AppDynamics agent’s directory contains information about the server LAMAXU will push JMX updates to.
Example;
This example uses the following values to identify the LAMAXU agent.
./conf/controller-info.xml
 <application-name>LAMAXU MQ</application-name>
 <tier-name>Messaging</tier-name>
 <node-name>Node 8536</node-name>
Adding the AppDynamics Agent to the Lamaxu Start-up
On Unix
Add the option in red below to the ${LAMAXU_HOME}/bin/startup.sh file.
nohup "$JAVA_HOME/bin/java" -javaagent:/app/AppServerAgent-4.0.6.0/ver4.0.6.0/javaagent.jar -DLOG_PATH=${LAMAXU_HOME}/logs -cp ${LAMAXU_CLASSPATH} com.qm.lamaxu.Main -config ${LAMAXU_HOME}/config/config.xml >nohup.out 2>&1 &
On Windows
On Windows, changes are required to the services configuration file wrapper.conf, see the sample.
Edit the file; C:\Program Files (x86)\QueueMetrix\LAMAXU\bin\yajsw\conf\wrapper.conf
On the second last line of the sample conf file you see the path to the AppD java agent. Please change the path to where your AppD agent is installed.
Example;
wrapper.java.additional.1 = -javaagent:C:\\Program Files (x86)\\AppServerAgent-4.0.6.0\\ver4.0.6.0\\javaagent.jar
The easiest way is replace the file located in the C:\Program Files (x86)\QueueMetrix\LAMAXU\bin\yajsw\conf\ directory, with the sample one attached after making the required changes. You’ll need to restart the service after the file has been changed.
Lamaxu ZOS JMX Metric Instrumentation Config
Download the JMX Config
Lamaxu Non-ZOS JMX Metric Instrumentation Config
Download the JMX Config
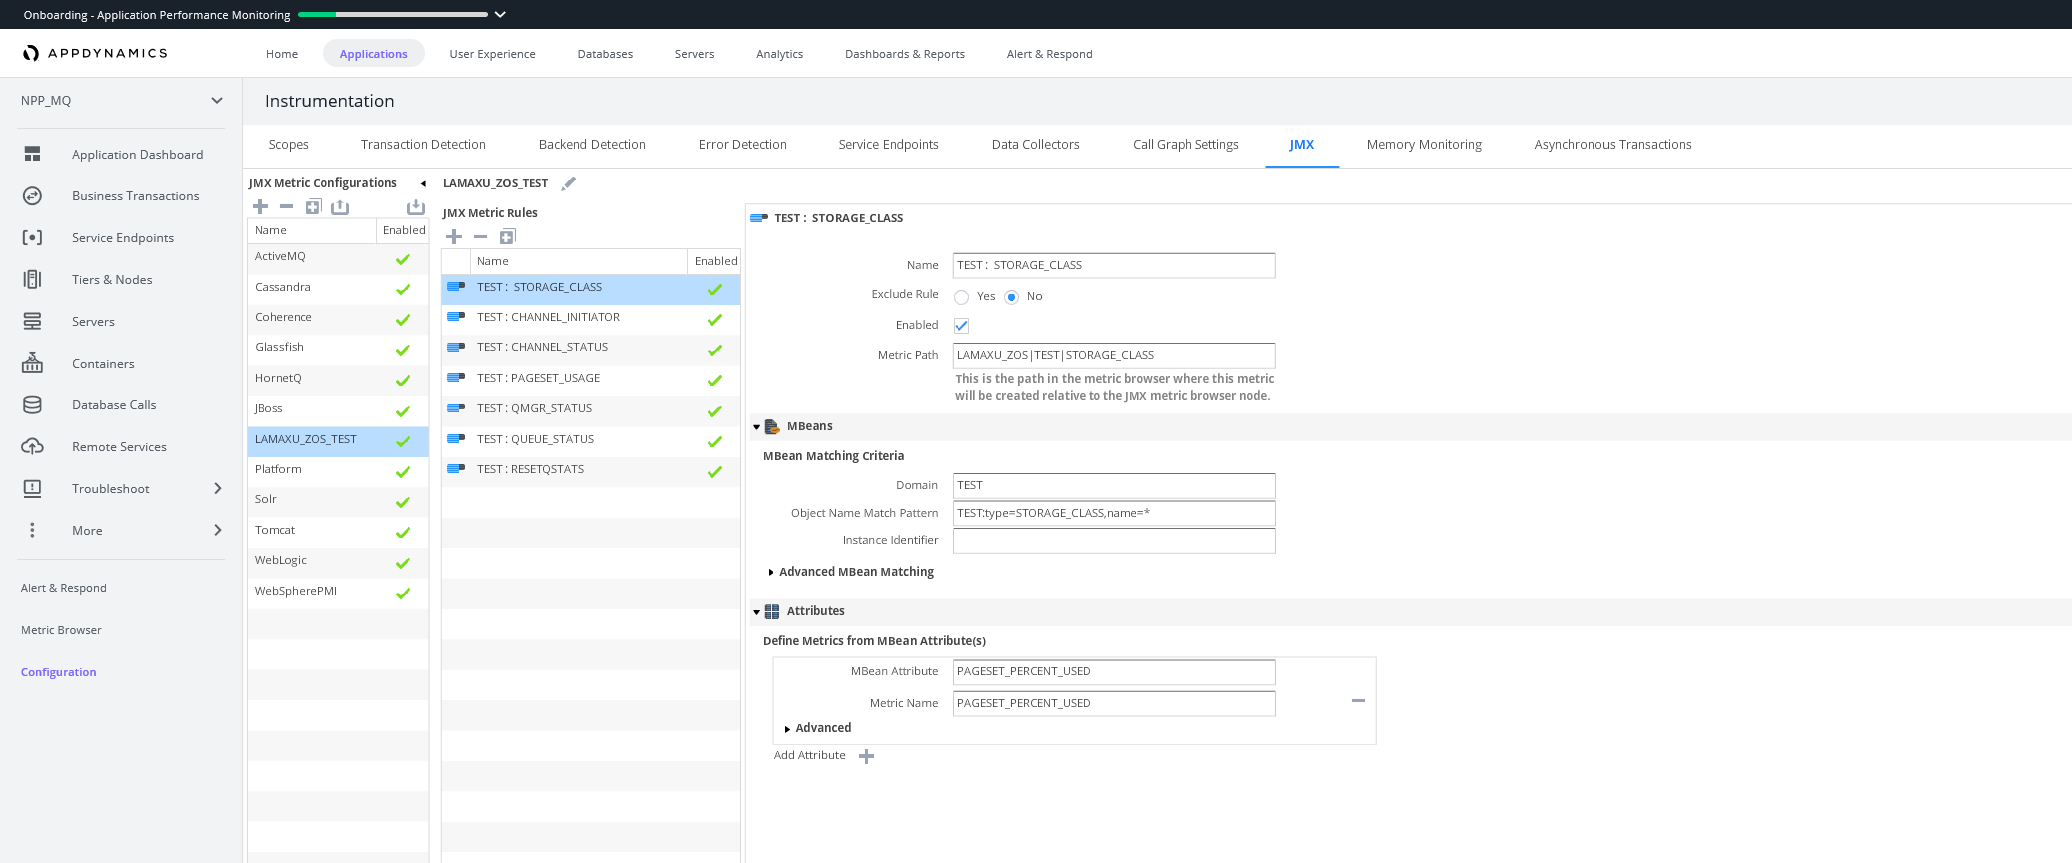
Navigate to Configuration > Instrumentation > JMX and select the 'Import JMX Configuration' Icon as shown below.
Once the file is imported, you will be able to see the generic JMX Metric rules.
Testing AppDynamics with Lamaxu
Once the Lamaxu agent has been started, open AppDynamics and navigate to the LAMAXU MQ Application on the menu.
Once in the Lamaxu MQ application, navigate to App Servers and select the node.
Navigate to ‘More/JMX’ and click on the ‘Refresh Domains’ button to view the monitored MQ queue manager MBeans, as show in screen shots below.
Can't See all the the MBeans?
As each MQ object is exposed as a JMX MBean, you may have exceeded the AppDynamics default 1000 MBean count limit if you have a lot of queues.
https://community.appdynamics.com/t5/Knowledge-Base/Can-Not-See-Expected-MBeans/ta-p/13948
Per Domain Limit
With some app servers, it is possible to exceed the MBean count limit for a domain. The limit is controlled by the jmx-max-mbeans-to-load-per-domain node property. The default value is 1000.
Attribute Limit
With some app servers, it is possible to exceed the MBean attribute limit. The limit is controlled by the jmx-max-mbean-attributes-to-load node property. The default value is 1000.
Solution: Increase the Limit
1. Register the appropriate limit node property from the Node Dashboard. Use these steps: Add a Node Property,
2. Enter an Integer value greater than the default value.
3. Restart the JVM/server.


